 Recently, we talked about the OAAA’s “Feel the Real” campaign. If you’re not familiar with the campaign, I suggest you read up here. Our topic of discussion was generally how cool the campaign was (conclusion: it was really cool.)
Now, we’re back to talk about what the campaign actually did. Yes, the “Feel the Real” campaign had real success and real results.
Targeted Launch
The campaign was launched initially in NYC for New York Advertising Week, and then launched in 19 other major markets for advertising. It was impossible not to notice, and consequently, earned itself a lot of attention. People, including influencers to the target audience, were Tweeting up a storm. The press caught on, with outlets like the Wall Street Journal, Creativity, PSFK, and AdAge covering the campaign. All said and done, the OOH ads generated $2.2 million in earned media.
Driving Real Digital Engagement
That’s all fine and good, how did people react? Every ad has a goal, and with no branding and only one call to action, we need to be sure people actually connected with the ads.
To be sure, the OAAA released a report of all the effects, including more than 27,000 unique visitors to the website, feelthereal.org. The audience came 73% from mobile, and 85% said they had seen an OOH ad in the real world. Knowing that OOH is nearly 3X more efficient at driving online activity than TV, radio and print, this makes sense. Traffic was significantly higher in the 20 markets where the ads appeared, and 40% of visitors were media, marketing, and advertising professionals.
Was it Real?
But was this all real? How can we trust digital information, isn’t digital bot-ridden?
Traffic from digital advertising is bot-ridden. The difference is that this traffic was driven by real ads in the real world. Let’s take a look at our first audience: real people. According to the OAAA’s analytics, there are clear patterns of traffic spikes along the morning commute, lunch, and evening commute. In fact, clear and sunny days resulted in more people engaging with the ads. Average time on the site was 2:09.
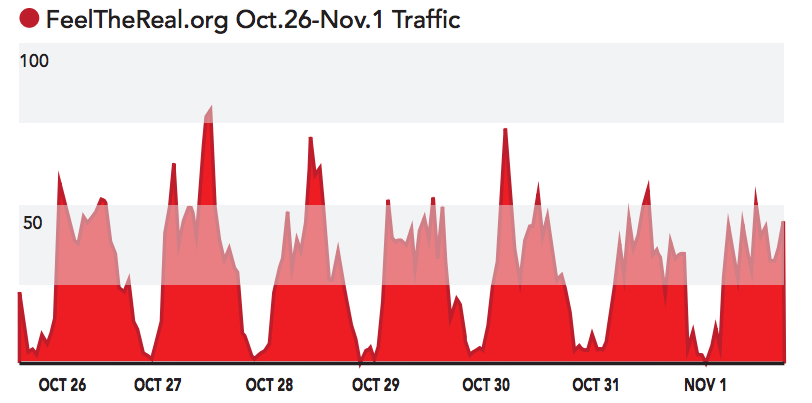
Each day has a spike of traffic around the commutes and lunchtime.
Let’s compare that to an unexpected audience: Reddit users. There’s no denying that the campaign was cool, and a testament to that is the days after the campaign period had ended when it went viral on Reddit. Of these users, only 9.8% self-identified as media, marketing, or advertising professionals. This indicates both that people answered honestly about themselves, and that the OOH really did target the correct audience.
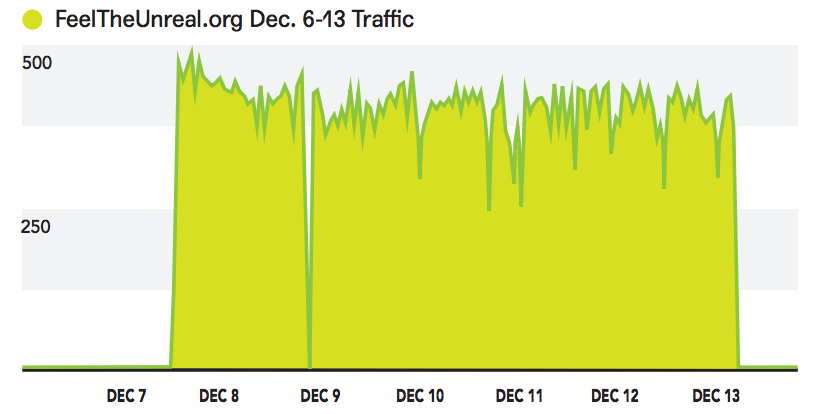
Now, let’s take a look at a third audience: bots. Yes, the OAAA invited bots via three traffic brokers to three alternate sites, FeelTheUnreal.org, FeelTheFake.org, and FeelTheBots.org. The results were notably un-human. For one broker, “visitors” answered the question “what drove you to this site” evenly, with a third saying OOH, a third saying digital, and a third saying WOM. There weren’t even any OOH units being displayed.
They didn’t answer the second question; for one broker, time on the site was 18 seconds. That’s not an average, every single “visitor” spent exactly 18 seconds. There were no spikes during the day, traffic was even across the board. The most expensive broker actually emulated human users, by using human users. It redirected users from expired gaming, dating, and porn sites.
Utterly unreal
The comparison makes it overwhelmingly clear that the audience that the real OOH delivered was decidedly… well, real.
Efficiency
So it was real and garnered traffic. But it did cost money, was it cost efficient? We won’t get into all the numbers here (you can find all of the calculations in detail in the OAAA’s report.) CPM came out to $14.06. Compare that to $24.60 for digital video, $3 for mobile, $1.90 for display, and $10.40 for premium display. The campaign’s CPM was significantly higher than some digital methods, but here’s the kicker: no bots. Accounting for bots, both AdWeek and MediaPost calculate a true CPM for digital display ads of $100.
Compare to that the $14.06 CPM for a campaign that delivered 237 million impressions and 27,061 unique visitors. Significantly more important is the audience, according to the OAAA: “40% of that traffic was highly qualified – media, advertising and marketing professionals in the prime of their careers in prime markets and top agencies with the most media buying power.”
So the “Feel the Real” campaign was cost-efficient. But that leads to the next question: was it effective?
Effectiveness
Short answer: yes. Take a look at this chart of sales growth across the OOH industry:
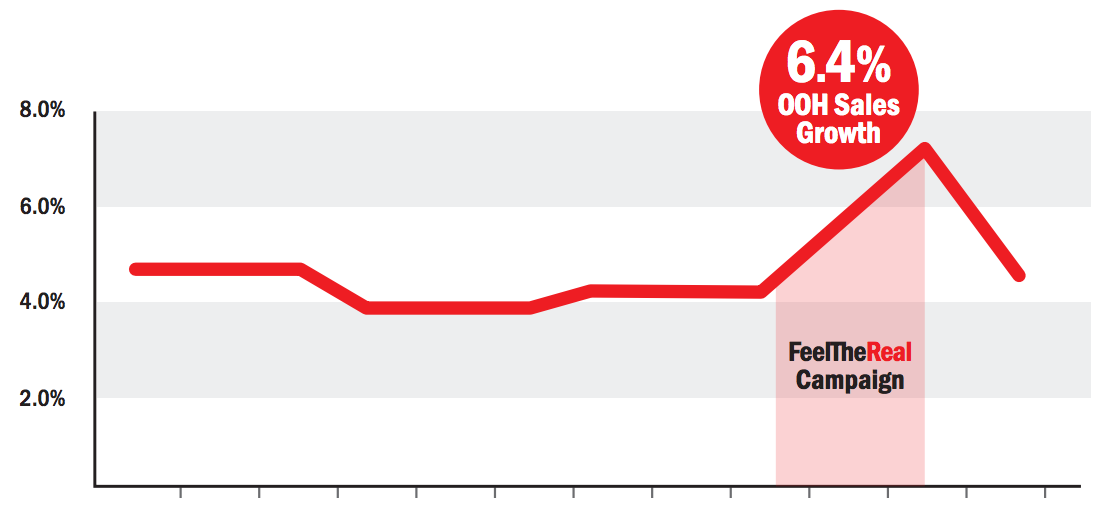
Remember that this is for a $7 billion industry. Moving a needle that large takes some power. That means an ROI of $23.3 million, or 7X the investment.
Feeling the Real
So the campaign worked. What comes next? An application of what this campaign taught us. The OAAA notes, “if OOH can do that TO media planners, imaging what it can do FOR media planners and their clients.” If this campaign has taught media planners anything, it should be that OOH drives real digital engagement. The next step is a new wave of media planners utilizing the full power of OOH to support and drive engagement as a part of a powerful, integrated plan


